Reporting, Analytics, and Big Data: A Continuous Feedback Loop to Drive Better Decision-Making
March 2, 2014 at 3:07 pm Mary Ludloff 3 comments
 A recent conversation with a client reminded me that no matter how crazy and exciting the Big Data world gets, it is still critical to understand what your goals are and where you are in the process of reaching those goals. Having a good foundation in “what’s important” is critical before you jump into the wild world of Big Analytics.
For example, in big data (well, actually all data but I digress) “Reporting” and “Analytics” are very different functions. But I often find our customers and prospects grappling with how to distinguish one from the other and as a result, confusing reporting with analysis and losing track of their real goals.
Don’t get me wrong—both are important. But they are also very different. Reporting is about tracking: watching the basic metrics that are key to attaining success in your business or environment. Analytics is about understanding: going beyond the basic math to understand exactly what is going on in your business or environment.
Basic reporting is a prerequisite to analytics, but it is not analytics. And when you learn something deeper as part of your Analytics process, often those metrics need to be incorporated back into your regular Reporting process. I believe that much of the confusion between the two stems from what should be a continuous feedback loop between these functions.
It is important to also understand that the technology requirements and investments are different as well: Trying to build a real Analytics process using technology only built for Reporting can make your life very difficult. So be very clear about what you are trying to accomplish with each function before you make those investments. Instead of leaping into all the bells and whistles that big data technology can provide, first understand how to think about your problems, decisions and/or questions. I often find that this is where getting confused about what you need to Report and what you need to Analyze can derail clients’ efforts to make data-based decisions that lead to competitive advantage.
The broad field of Business Intelligence, which supports the Reporting function, has helped many companies make huge improvements over the years. Certainly, the Reporting tools have improved through the introduction of dashboards, KPIs, emailed PDF reports, etc. Equally, we are getting better Analytics tools every day—tools that enable a deeper understanding of data (new and old) with new, more complex metrics. And growing numeracy in our organizations is bringing more smart minds to data-based decision making. But remember that the tools you select should help you achieve your goals—from a Reporting and Analytics perspective.
The following table shows my thought process regarding Reporting versus Analytics. I like to think of the functions as requisite steps in a process.
| Reporting | First, think about the questions or problems or situations that your business/environment encounters on a regular basis.
This is Reporting. You may have done Analysis to determine that the metrics you are tracking in this first step are actually the critical levels for your environment. But once the question of importance is answered, they become regular metrics, or KPIs, for your decisions. Getting through this first step is a critical prerequisite for Analytics. During this step, you will figure out all sorts of important things in your data – do you have the right data, what additional data do you need, how will you collect it, is it clean, how will you clean it…. etc.? Until you’ve got good Reporting set up, you can’t build a real Analytics process. |
| Analytics: Find and correlate Influencers | The second step is the beginning of the Analytics process. Here is where you start to:
You can also think of this as the beginning of a diagnosis process. Reporting will tell you what has happened, and step two starts to tell you why. But it’s only a start—because answers usually only create more questions. |
| Analytics: Association or Causation? | Third, you need to separate out what’s important from the noise. As you’ve no doubt heard many times before “Association is not Causation.” Just because there is a relationship between a lever you can pull and your success metric doesn’t mean that actually pulling that lever will bring you success. Now you need to dig deeper into your data to measure the relationships between drivers. Regression, especially across multiple factors, is a good basic tool for getting through the noise. |
| Analytics: Getting to Answers | From here on, you have to put your findings to work and see if your Analysis holds true going forward. This is an iterative process of testing, and analyzing, and testing again. This is when you can start to take what you’ve learned in the previous steps and start planning for how to turn the knobs to get better at what’s important. And in many situations it is critical to constantly bring in new data to evaluate the hypothesis about your business or environment in a real-time way. |
The following illustration shows how PatternBuilders analytics tools and functionality come into play throughout the Analytics process.
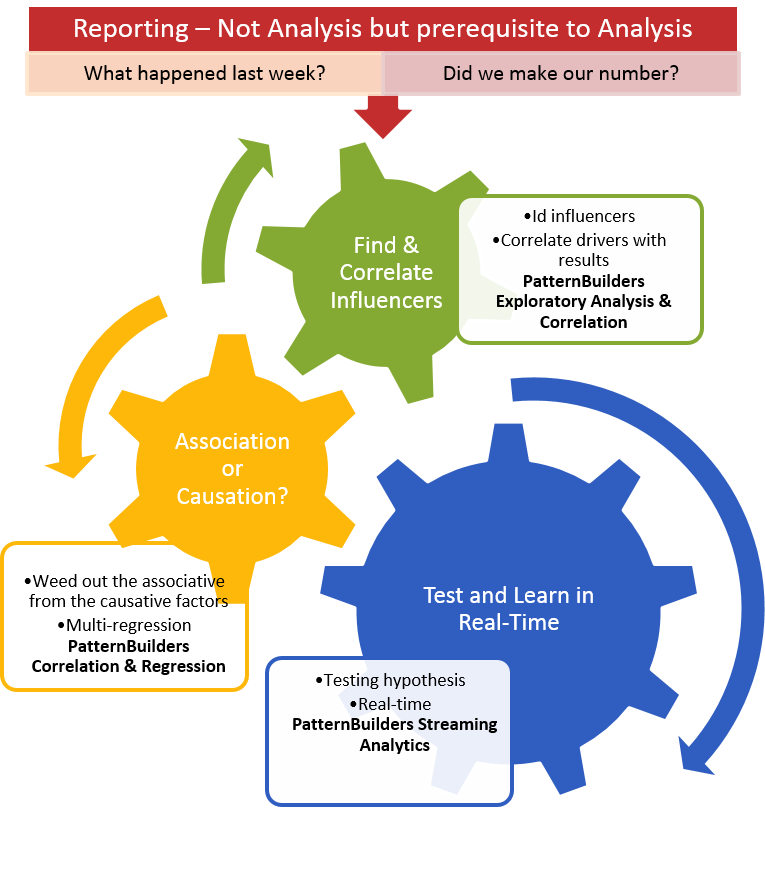
So in summary, while Reporting and Analytics are important, they serve two very different functions: tracking information (or data) versus understanding what that information (or data) may mean. You have to have a strong Reporting environment, including understanding what’s important to you, before you can even start to think about Analytics. Then when you’ve got the foundation down, you can start digging in and using Analytics to drive your decision-making process.
Entry filed under: General Analytics.
3 Comments Add your own
Leave a comment
Trackback this post | Subscribe to the comments via RSS Feed


1. BigData Weekly Updates | March 5, 2014 at 6:24 pm
[…] Reporting, Analytics, and Big Data: A Continuous Feedback Loop to … http://blog.patternbuilders.com/Having a good foundation in “what's important” is critical before you jump into the wild world of Big Analytics. For example, in big data (well, actually all data but I digress) “Reporting” and “Analytics” are very different functions. […]
LikeLike
2. Lessons Learned from the Google Flu Tracker—Why We Need More Than Just Data | Big Data Big Analytics | April 9, 2014 at 6:17 pm
[…] us of the dangers of ignoring the natural cycles of an analytics process that we talked about in this recent post. If Google followed the PatternBuilders Analytics Methodology, they might have avoided many of the […]
LikeLike
3. google | August 1, 2014 at 10:11 am
Awesome post.
LikeLike